C2SM Newsletter vol. 29
Topics in this Newsletter - November 2019
- News from the Steering Committee
- Global modelling activities
- Scientific visualization activities
- News from MeteoSwiss
- News from Empa
- Selected press articles
- PhD defenses in the C2SM community
- Upcoming events of interest
- Paper: Effects of land use and anthropogenic aerosol emissions in the Roman Empire
- Papers: Diabatic processes in extratropical cyclones simulated with COSMO and IFS
- Paper: Projections of Alpine Snow-Cover in a High-Resolution Climate Simulation
- Papers: The Mediterranean climate change hot spot and it’s causes
- Paper: Stratospheric ozone trends for 1985-2018: sensitivity to recent large variability

Status update external evaluation of C2SM
After the successful external review in August and all directors’ meeting in the middle of October, we are now to submit the final documentation for the formal request to the school board, which consists of the final self-evaluation and business plan, support letters from the D-USYS department and the member institutions, the response to the review letter, and a draft of the new bylaws. The decision is expected by the end of November.
The request is based on a roughly doubled budget for the core team and activities of C2SM and will secure our funding up to 2025. The request also foresees C2SM to transition into an extra-departmental institution that reports directly to the Vice-president for research. We hope to provide a longer report at the assembly on 28 November 2019.
New staff at C2SM
Matthieu Leclair will start in January 2020 as the second scientific programmer for the RCM working group at a percentage of 40%. C2SM shares his expertise with Christoph Schär’s group, for which he will provide technical support around the COSMO model (40%).
Global modelling activities
Recent activities from the global climate modelling group included the preparation of emission files for the participation of the ECHAM-HAMMOZ consortium in the AerChemMIP initiative. The global climate modelling group supported the ICON model by installing different ICON versions on CSCS ant ETHZ computers, creating and organizing the C2SM ICON organization on GitHub, and write documentation.
Besides, C2SM organized two ICON meetings for its community members. The C2SM-ICON meetings are announced via a mailing list. If you wish to subscribe, please send a short email to
Scientific visualization activities
Exciting animations have been created and successful workshops carried out in scientific visualization during the last half year.
We have been working on a fascinating animation for the the European Space Agency (ESA) SmartCarb project together with Dominik Brunner (Empa). It shows CO2 field evolution right from the global scale down to the scale of individual power plants, and the swaths of satellites envisioned to record CO2 at high resolution. For the first time, we have collaborated with a composer to add music and narration to our animation. An intermediate version of this animation was shown at the ESA booth at the living planet symposium, and the final version is targeted towards ESA's CO2M Mission Advisory Group meeting to take place on 20-21 of November 2019. A preliminary version is already available on our Vimeo channel, and the final version will be released soon.
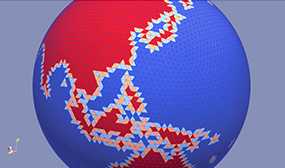
We have also created an exciting animation together with Prof. Nicolas Gruber showing the increase in surface ocean CO2. This animation, along with another one we did for Prof. David Bresch, was shown at the "Call for Globes" exhibition in the ETH main building from October 4th-13th 2019. Another piece of our work, which received attention, was an animation we created for Klimarunde 2019. This animation highlighted the area of Switzerland under zero degrees during the winter months. We combined past observations and the future model predictions to visually demonstrate the shrinking of this "under zero-degrees region".
In our efforts to be able to provide cutting edge technology support to our members, we also evaluated/evaluating sophisticated software stack for creating interactive web visualizations (D3.js). We have also assessed simpler to use Python libraries such as Dash/plotly and Folium for such visualizations.
Our popular Scientific Visualization using Python workshop was conducted again with great interest from the community. For the first time, we also organized a one-day workshop on introduction to Python programming with the support of Scientific IT Services of ETH Zurich. One of the aims of the latter workshop was to prepare our participants for the more advanced visualization workshop. Here again, our community showed great interest.
We recommend staying tuned to our Vimeo channel for new and exciting animations.
Our visualization expert () is available in case you have any questions or need support.
News from MeteoSwiss
ETH Zurich and MeteoSwiss are working with Appenzeller Bahnen on an Innosuisse project to improve the Laseyerwind warnings to prevent trains from overturning. The IAC group for atmospheric dynamics develops an algorithm to predict wind peaks of the Laseyerwind in the narrow Schwende valley more precisely from measurement and model data (COSMO-1). On this basis, MeteoSwiss’ department Development of Forecasting develops a probabilistic, customer-specific wind warning system to implement a risk-based planning of the train operations.
Representing the Urban Heat Island Effect in Future Climates
A recently completed master thesis (conducted as collaborative project between MeteoSwiss, ETH Zurich and the University of Augsburg) investigates the urban heat island (UHI) effect in future climates by analyzing temperature data at both rural and urban sites in Switzerland and the northern Alpine Foreland. For rural sites, climate scenario data are available through CH2018. Due to lacking temperature projections for urban sites, statistical and physically-based methods are tested to transfer the CH2018 scenarios to the respective urban counterparts. The urban-rural temperature difference, i.e. the UHI, in future climates is then analyzed in terms of standard climate indices such as tropical nights, summer days and hot days. Results of urban and rural climate scenarios clearly indicate a strong increase in the frequency of heat indices until the end of the 21st century. Consistent with what is known from literature, the scenarios simulate distinct urban-rural temperature differences (UHI effect) mainly during nighttime, which becomes obvious when considering the frequency of tropical nights based on the daily minimum temperature (see Figure 1 for Zurich).
For detailed information, please contact
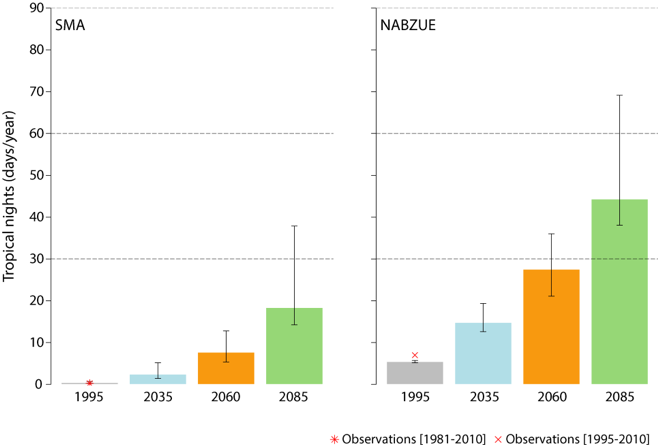
Figure 1: Frequency of tropical nights per year averaged over 30-year periods (centered around 1995, 2035, 2060, 2085) at the exemplary Zurich station couple SMA (rural site; left) and NABZUE (urban site; right) for RCP8.5. Bars indicate the ensemble median value, whiskers the 5-95% model range.

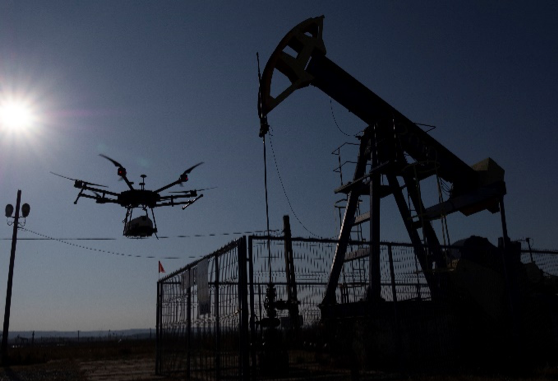
Methane simulations with COSMO-GHG supporting a large international measurement campaign in Romania
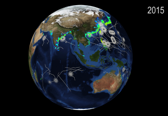
Romania is one of the largest European emitters of methane (CH4) due to oil and gas production. These emissions occur at thousands of oil and gas wells during normal operation due to leaks and venting. Because the amount of CH4 emitted is highly uncertain, a large measurement campaign ROMEO (ROmanian Methane Emissions from Oil & gas) was organized by an international consortium of scientists and companies from 20 nations to quantify these emissions using measurements of atmospheric CH4 from cars, drones and airplanes. The campaign was conducted under the leadership of the European ITN project MEMO2 and was co-sponsored by the United Nations Environment Program.
Empa, as one of the partners, operated its new ultralight high-precision CH4 laser spectrometer on a drone and measured the often very large (up to several 100 ppm) CH4 enhancements downwind of the leaking wells. In addition, Empa provided daily model forecasts of weather and CH4 concentrations to support the planning of the ground and aircraft measurement teams. Each day, a 5-day forecast was computed for Romania with the COSMO-GHG model driven at the lateral boundaries by operational weather and CH4 forecasts from ECMWF and the Copernicus Atmospheric Monitoring Service (CAMS). All simulations were performed at the Swiss National Supercomputing Centre CSCS. For each forecast, 45'000 figures were produced and made available through an interactive website (http://romeo-memo2.wikidot.com).
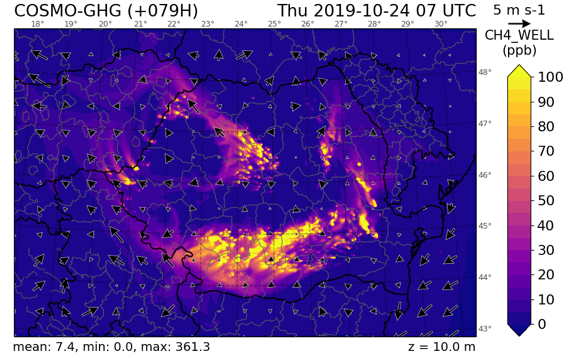
The figures presenting horizontal maps and vertical cross-sections of meteorological parameters and CH4 allowed the experimental teams to optimize their measurement strategy. The campaign was highly successful providing observations at more than 800 wells. Analysis of the unique data set produced by ROMEO has just started.
Selected press articles

- TagesAnzeiger: „external page So heiss wird es in Zürich in 40 Jahren“ (Article by P. Vögeli und M. Brupbacher based on the CH2018 climate scenarios, July 2019
- Schaffhauser Fernsehen: external page Hüt im Gschpröch mit A. Fischer zum neuen Klimaanpassungsbericht des Kt. Schaffhausen, July 2019
- TagesAnzeiger: „external page Die letzten drei Sommer waren alles Jahrhundertereignisse“ (Article by P. Vögeli und M. Brupbacher with interview by S. Bader), September 2019
PhD Defenses in the C2SM community

We congratulate our community members for their successfully completed PhDs!
Roman Brogli: Disentangling Drivers and Patterns of European Climate Change. Diss. ETH No. 26388, 18 October 2019.
Daniele Nerini: Ensemble precipitation nowcasting: spatial scales, localization and seamless blending. ETH Zurich, 12 June 2019.
Laureline Hentgen: Clouds in Convection-Resolving Climate Simulations over Europe and the Tropical Atlantic. Diss. ETH No. 26405, 28 October 2019.
Daniel Steinfeld: The role of latent heating in atmospheric blocking – climatology and numerical experiments. ETH Zurich, 15 May 2019.

Paper: Effects of land use and anthropogenic aerosol emissions in the Roman Empire
Did the Romans have an impact on climate already 2000 years ago? Using the global aerosol-climate model ECHAM-HAM-SALSA, we estimated the possible anthropogenic impact of land use as well as aerosol emissions from burning activities (fuel consumption, crop residue burning, and pasture burning). For the simulations, two existing land use scenarios were used and three novel aerosol emission scenarios were created. The results suggest that both land use and aerosol emissions could have had an impact on climate. While land use induces a regional warming in one of the two scenarios, the anthropogenic aerosol emissions enhance the cooling effect of the clouds for all three scenarios. The magnitude of these changes in temperature is uncertain due to e.g. the prescribed sea surface temperatures.
Effects of land use and anthropogenic aerosol emissions in the Roman Empire by Gilgen, A., S. Wilkenskjeld, J.O. Kaplan, T. Kühn and U. Lohmann, Climate of the Past, 2019, in press, https://doi.org/10.5194/cp-15-1885-2019
Papers: Diabatic processes in extratropical cyclones simulated with COSMO and IFS
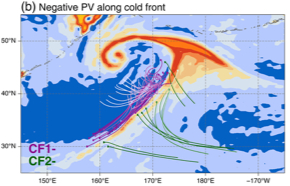
Three publications present detailed results about different aspects of moist dynamics in extratropical cyclones. The first study investigates the occurrence of embedded convection in warm conveyor belts, simulated with kilometre-scale COSMO simulations of a North Atlantic cyclone (Oertel et al. 2019). Episodes of fast ascent along warm conveyor belt trajectories calculated online during the COSMO integration reveal that convection occurs embedded within the larger-scale slantwise ascent, leading to prominent surface precipitation maxima and a heterogeneous cloud texture, in agreement with satellite observations. Two other studies focus on non-conservative processes that modify the potential vorticity (PV) in extratropical cyclones near the surface (Attinger et al. 2019) and near the tropopause (Spreitzer et al. 2019). IFS simulations are performed with detailed output of temperature and momentum tendencies for individual parameterisations, allowing for a detailed Lagrangian budget analysis of the formation of positive and negative PV anomalies. The results show that, in addition to latent heating by condensation, below-cloud processes (e.g., snow sublimation and rain evaporation) as well as turbulence contribute essentially to the formation of important PV features.
Attinger, R., E. Spreitzer, M. Boettcher, R. Forbes, H. Wernli, and H. Joos, 2019. Quantifying the role of individual diabatic processes for the formation of PV anomalies in a North Pacific cyclone. Quart. J. Roy. Meteorol. Soc., 145, 2454–2476. doi.org/10.1002/qj.3573
Oertel, A., M. Boettcher, H. Joos, M. Sprenger, H. Konow, M. Hagen, and H. Wernli, 2019. Convective activity in an extratropical cyclone and its warm conveyor belt – a case-study combining observations and a convection-permitting model simulation. Quart. J. Roy. Meteorol. Soc., 145, 1406–1426. doi.org/10.1002/qj.3500
Spreitzer, E., R. Attinger, M. Boettcher, R. Forbes, H. Wernli, and H. Joos, 2019. Modification of potential vorticity near the tropopause by nonconservative processes in the ECMWF model. J. Atmos. Sci., 76, 1709–1726. doi.org/10.1175/JAS-D-18-0295.1
Paper: Projections of Alpine Snow-Cover in a High-Resolution Climate Simulation
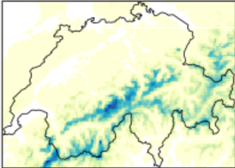
Besides allowing for an improved representation of precipitation and cloud cover, increased horizontal resolution in regional climate models also allows for a better representation of snow cover. The major cause for this improvement is the more accurate capture of topography, which influences quantities like snow depth and snow cover duration via the temperature lapse rate. In this study, we compare modelled snow cover for the Greater Alpine Region in a set of decadal-long COSMO simulations with different horizontal resolutions (50, 12 and 2.2 km). The performance of the simulations is evaluated with a gridded snow water equivalent (SWE) dataset for Switzerland. Only the 2.2 km simulation is able to capture elevations above 3000 m a.s.l., where substantial parts of the cryosphere (e.g. glaciers and permafrost) are located. The model evaluation indicates that the coarser-scale simulations (12 and 50 km) underestimate spatially averaged SWE throughout the winter, whereas the 2.2 km simulation reveals an excellent agreement with observations. Scenario simulations for the RCP8.5 and driven by the GCM MPI-ESM-LR reveal a distinctive decrease of SWE over the Alps. Highest relative changes in SWE are found at lower elevations (< 2000 m a.s.l.) but pronounced changes are also evident at high altitudes (> 3000 m a.s.l.), where SWE is projected to decrease between ~20-80% depending on the season and elevation.
Lüthi, S., Ban, N., Kotlarski, S., Steger, C. R., Jonas, T. and Schär, C., 2019: Projections of Alpine Snow-Cover in a High-Resolution Climate Simulation, Atmosphere, 10, 463, doi.org/10.3390/atmos10080463
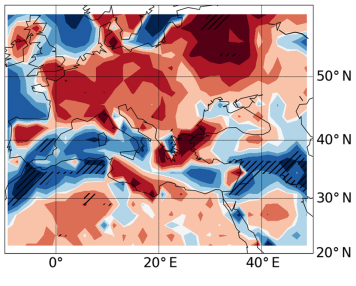
Papers: The Mediterranean climate change hot spot and it’s causes
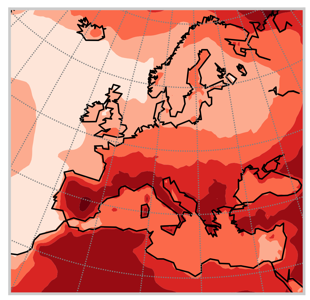
The Mediterranean region is a hot spot for future climate change, mainly due to the expected strong summer warming as well as the year-round precipitation decline. In our papers, we aim to identify the responsible physical drivers behind the regional temperature and precipitation changes. We find that the strong summer warming is due to large-scale changes in the vertical structure of the atmosphere (increases and spatial variations in lapse-rate), while – contrary to expectations – the northward shift and expansion of the Hadley cell has a negligible influence. The causes for the precipitation decline depend on the season. In summer, changes in thermodynamics, lapse-rates, and land-ocean temperature contrast are important and circulation changes play a secondary role. In winter, changes in circulation are the primary cause for the projected Mediterranean precipitation decline.
Brogli, R., Kröner, N., Sørland, S. L., Lüthi, D., & Schär, C. (2019). The Role of Hadley Circulation and Lapse-Rate Changes for the Future European Summer Climate. J. Climate, 32, 385–404. 10.1175/JCLI-D-18-0431.1
Brogli, R., Sørland, S. L., Kröner, N., & Schär, C. (2019). Causes of future Mediterranean precipitation decline depend on the season. Environ. Res. Lett., 14, 114017. 10.1088/1748-9326/ab4438
Paper: Stratospheric ozone trends for 1985-2018: sensitivity to recent large variability
Ozone in the stratosphere acts as a protective shield against ultraviolet radiation that may harm the biosphere, and leads to cataracts, skin damage, and skin cancer in humans. The ozone layer was damaged last century due to anthropogenic emissions of ozone depleting substances. A global effort, through the Montreal Protocol, halted emissions and the ozone layer is no longer clearly thinning. However, there is still no evidence of a statistically significant increase in total column ozone since 1998. In previous work, we showed that lower stratospheric ozone had continued to decline over 1998–2016, counter to modelling expectations, and is likely responsible for the non-detection of a recovery. While surprising, many questions remained as to the robustness of this result, related to natural atmospheric variability, confidence in the observations, and the efficacy of trend analysis approaches. In this paper, we extend the data series, and address many of the aforementioned concerns. Ultimately, we demonstrate that the lower stratospheric ozone trends remain in place and ozone remains lower in 2018 than in 1998. Further, we show that tropical stratospheric ozone (30° S–30° N) shows highly probable decreases in both the lower stratosphere and in the integrated stratospheric ozone layer. The paper reinforces the need to understand both the drivers and why chemistry climate models may not be reproducing these changes.
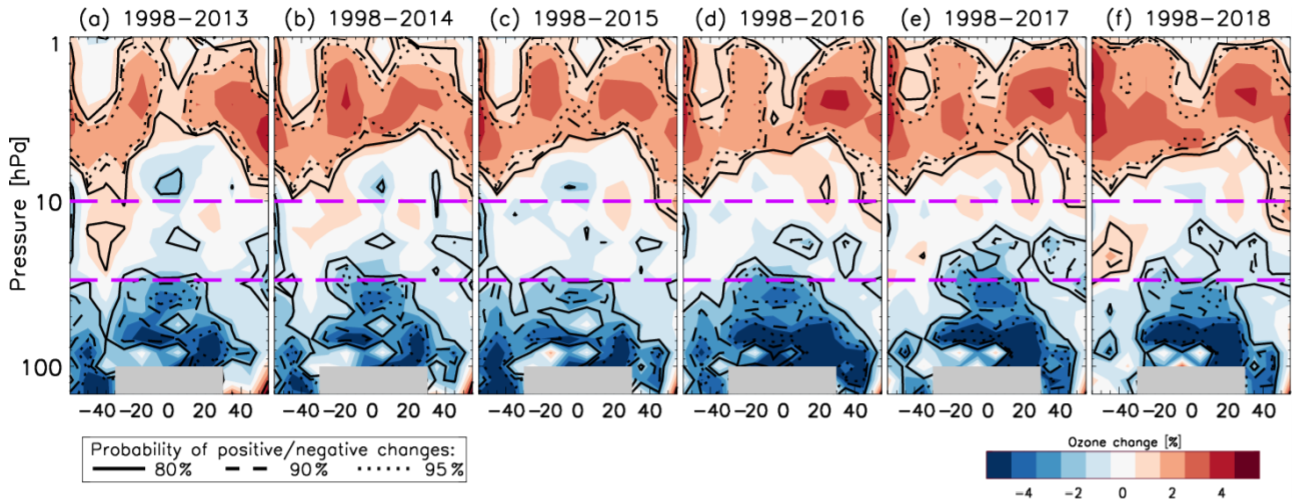
Fig caption (from Fig 1 of the paper): Zonally averaged ozone changes between 1998 and the end years from (a) 2013 to (f) 2018. Red represents increases, and blue denotes decreases (%; see right-hand legend). Contours represent probability levels of positive or negative changes (see left-hand legend). Grey shaded regions represent unavailable data. Magenta dashed lines delimit regions integrated to partial ozone columns in other figures.
Ball, W.T., Alsing, J., Staehelin, J., Davis, S.M., Froidevaux, L., Peter, T. (2019). Stratospheric ozone trends for 1985-2018: sensitivity to recent large variability, Atmos. Chem. Phys., 19, 12731-12748. https://doi.org/10.5194/acp-19-12731-2019